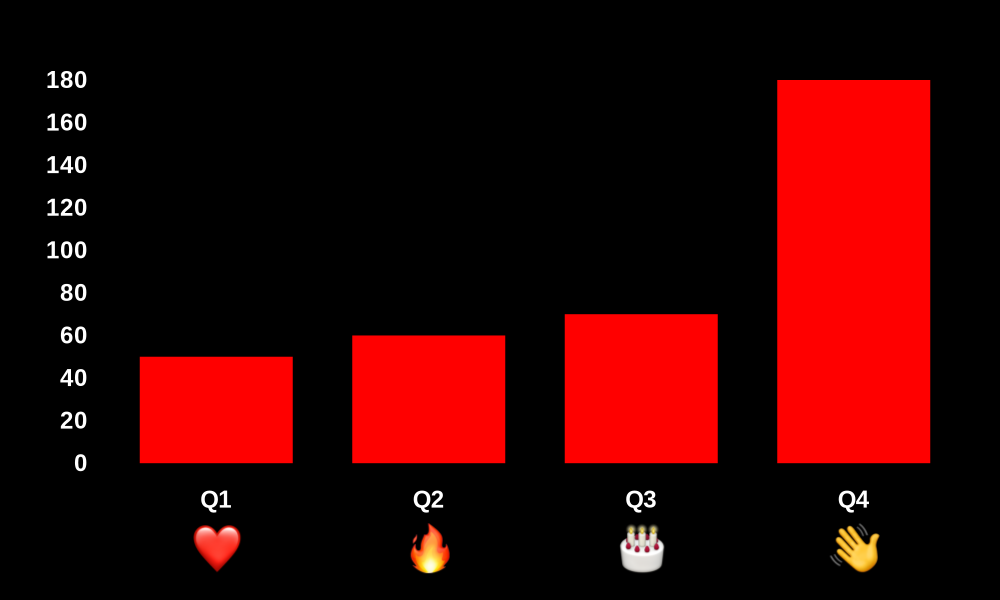
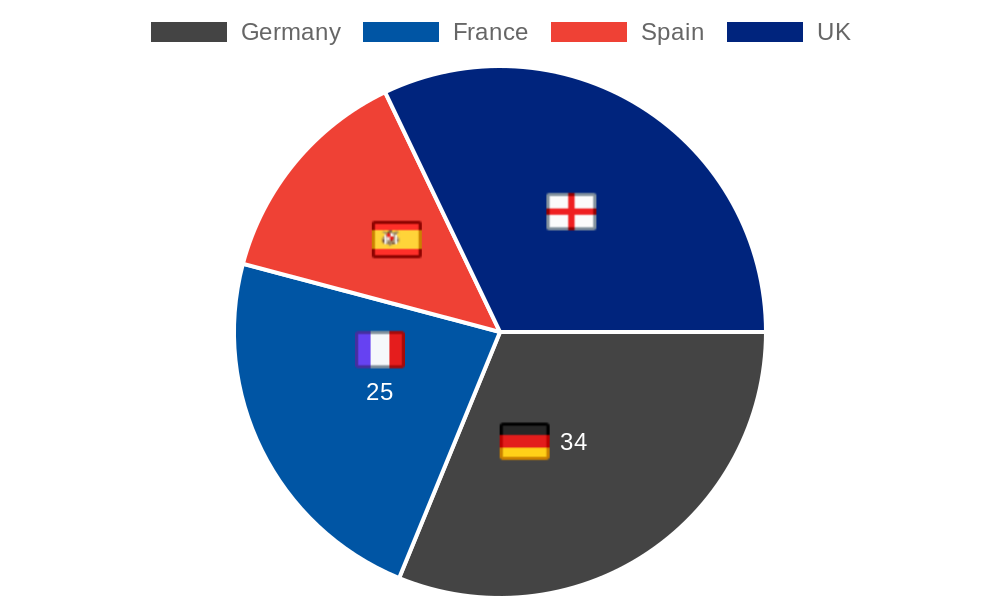
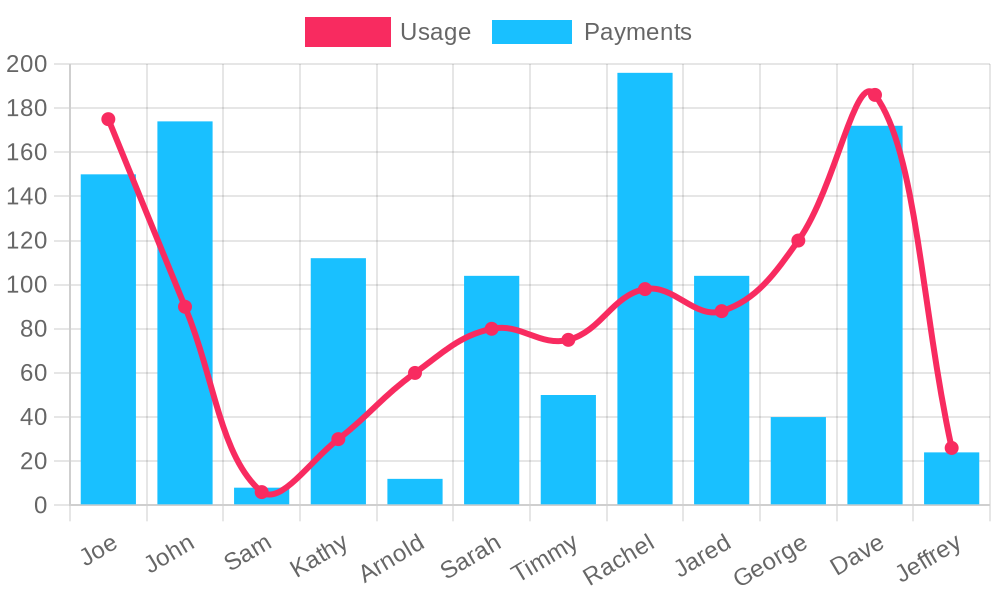
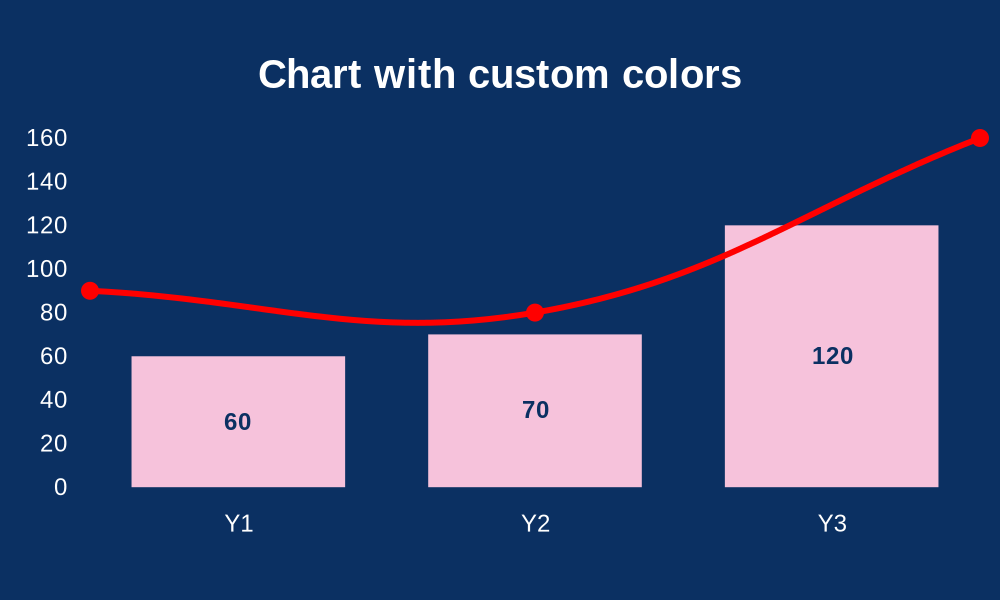
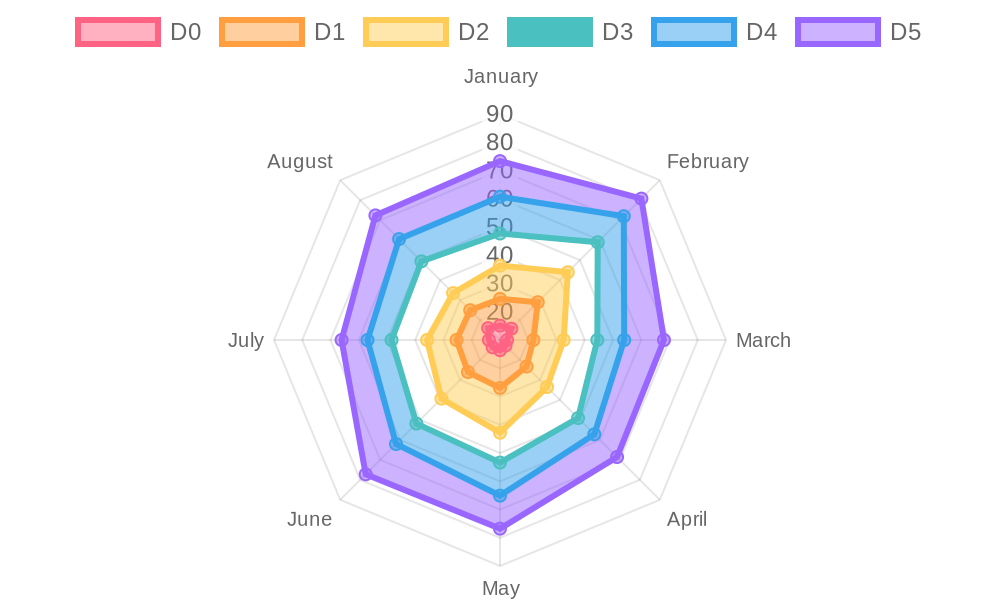
Each chart shown below is a QuickChart image built with a Chart.js config. These images can be sent in emails or embedded in any platform.
Click an image below to view and edit the chart config. These examples will help you get started with QuickChart and Chart.js. Need help? View documentation or get in touch.
Some examples above are based on examples from the Chart.js project.


%27%20%7D%5D%20%7D%2C%0A%20%20options%3A%20%7B%0A%20%20%20%20centerArea%3A%20%7B%0A%20%20%20%20%20%20fontSize%3A%2025%2C%0A%20%20%20%20%20%20fontColor%3A%20%27red%27%2C%0A%20%20%20%20%20%20fontWeight%3A%20%27bold%27%0A%20%20%20%20%7D%2C%0A%20%20%20%20plugins%3A%20%7B%0A%20%20%20%20%20%20backgroundImageUrl%3A%20%27https%3A%2F%2Fpyxis.nymag.com%2Fv1%2Fimgs%2Fdc5%2F011%2F2ea57ca9a7a5d9518b2f3cd94ccdde218f-25-emoji-subpoena.rsocial.w1200.jpg%27%2C%20%0A%20%20%20%20%7D%0A%20%20%7D%2C%0A%7D)
.keys()%5D%0A%2C%0A%20%20%20%20datasets%3A%20%5B%0A%20%20%20%20%20%20%7B%0A%20%20%20%20%20%20%20%20backgroundColor%3A%20getImageFill(%27https%3A%2F%2Fcdn.pixabay.com%2Fphoto%2F2017%2F08%2F30%2F01%2F05%2Fmilky-way-2695569__340.jpg%27)%2C%0A%20%20%20%20%20%20%20%20borderColor%3A%20%27green%27%2C%0A%20%20%20%20%20%20%20%20borderWidth%3A%201%2C%0A%20%20%20%20%20%20%20%20pointRadius%3A%200%2C%0A%20%20%20%20%20%20%20%20data%3A%20%5B...Array(100)%5D.map(e%20%3D%3E%20~~(Math.random()*100)%20%2B%2025)%2C%0A%20%20%20%20%20%20%7D%2C%0A%20%20%20%20%5D%2C%0A%20%20%7D%2C%0A%20%20options%3A%20%7B%0A%20%20%20%20legend%3A%20%7B%0A%20%20%20%20%20%20display%3A%20false%0A%20%20%20%20%7D%2C%0A%20%20%20%20scale%3A%20%7B%0A%20%20%20%20%20%20ticks%3A%20%7B%0A%20%20%20%20%20%20%20%20beginAtZero%3A%20true%2C%0A%20%20%20%20%20%20%7D%2C%0A%20%20%20%20%20%20angleLines%3A%20%7B%0A%20%20%20%20%20%20%20%20display%3A%20false%0A%20%20%20%20%20%20%7D%2C%0A%20%20%20%20%20%20pointLabels%3A%20%7B%0A%20%20%20%20%20%20%20%20display%3A%20false%0A%20%20%20%20%20%20%7D%2C%0A%20%20%20%20%7D%0A%20%20%7D%2C%0A%7D%0A)
%27%2C%0A%20%20%20%20%20%20pointBackgroundColor%3A%20%27%23fff%27%2C%0A%20%20%20%20%20%20pointRadius%3A%205%2C%0A%20%20%20%20%20%20data%3A%20%5B7%2C%207%2C%209.5%2C%2014.5%2C%2018%2C%2022%2C%2025.5%2C%2026.5%2C%2023.5%2C%2018%2C%2014%2C%209.5%5D%2C%0A%20%20%20%20%20%20pointStyle%3A%20%5Bnull%2C%20null%2C%20null%2C%20null%2C%20getImage(%27https%3A%2F%2Fi.imgur.com%2FyDYW1I7.png%27)%5D%2C%0A%20%20%20%20%7D%2C%20%7B%0A%20%20%20%20%20%20label%3A%20%27London%27%2C%0A%20%20%20%20%20%20fill%3A%20false%2C%0A%20%20%20%20%20%20borderColor%3A%20%27rgba(192%2C192%2C75%2C1)%27%2C%0A%20%20%20%20%20%20pointBackgroundColor%3A%20%27%23fff%27%2C%0A%20%20%20%20%20%20pointRadius%3A%205%2C%0A%20%20%20%20%20%20data%3A%20%5B4%2C%204.5%2C%206%2C%208%2C%2012%2C%2015%2C%2017%2C%2016%2C%2014%2C%2011%2C%207%2C%205%5D%2C%0A%20%20%20%20%20%20pointStyle%3A%20%5Bnull%2C%20null%2C%20null%2C%20null%2C%20null%2C%20null%2C%20getImage(%27https%3A%2F%2Fi.imgur.com%2FDIbr9q1.png%27)%5D%2C%0A%20%20%20%20%7D%5D%0A%20%20%7D%2C%0A%20%20options%3A%20%7B%0A%20%20%20%20scales%3A%20%7B%0A%20%20%20%20%20%20yAxes%3A%20%5B%7B%0A%20%20%20%20%20%20%20%20ticks%3A%20%7B%0A%20%20%20%20%20%20%20%20%20%20beginAtZero%3A%20true%0A%20%20%20%20%20%20%20%20%7D%0A%20%20%20%20%20%20%7D%5D%0A%20%20%20%20%7D%2C%0A%20%20%7D%2C%0A%7D)