Automate chart creation with Chart Maker (no code)
QuickChart is a no-code solution to automatic chart generation. Create a chart template using the chart maker interface. Then use the template endpoint to customize and generate charts automatically.
In this guide, you will learn how to:
- Create and customize a chart template without any code.
- Save the chart as a URL (API endpoint) that you can use in emails, Excel, Salesforce, and any other formats.
- Set the chart's data by providing special parameters in the URL.
Create a chart template
To create charts online, first go to the chart maker. Use the interface to build a chart template. This chart will be the basis of the charts you generate automatically in the future.
Add data
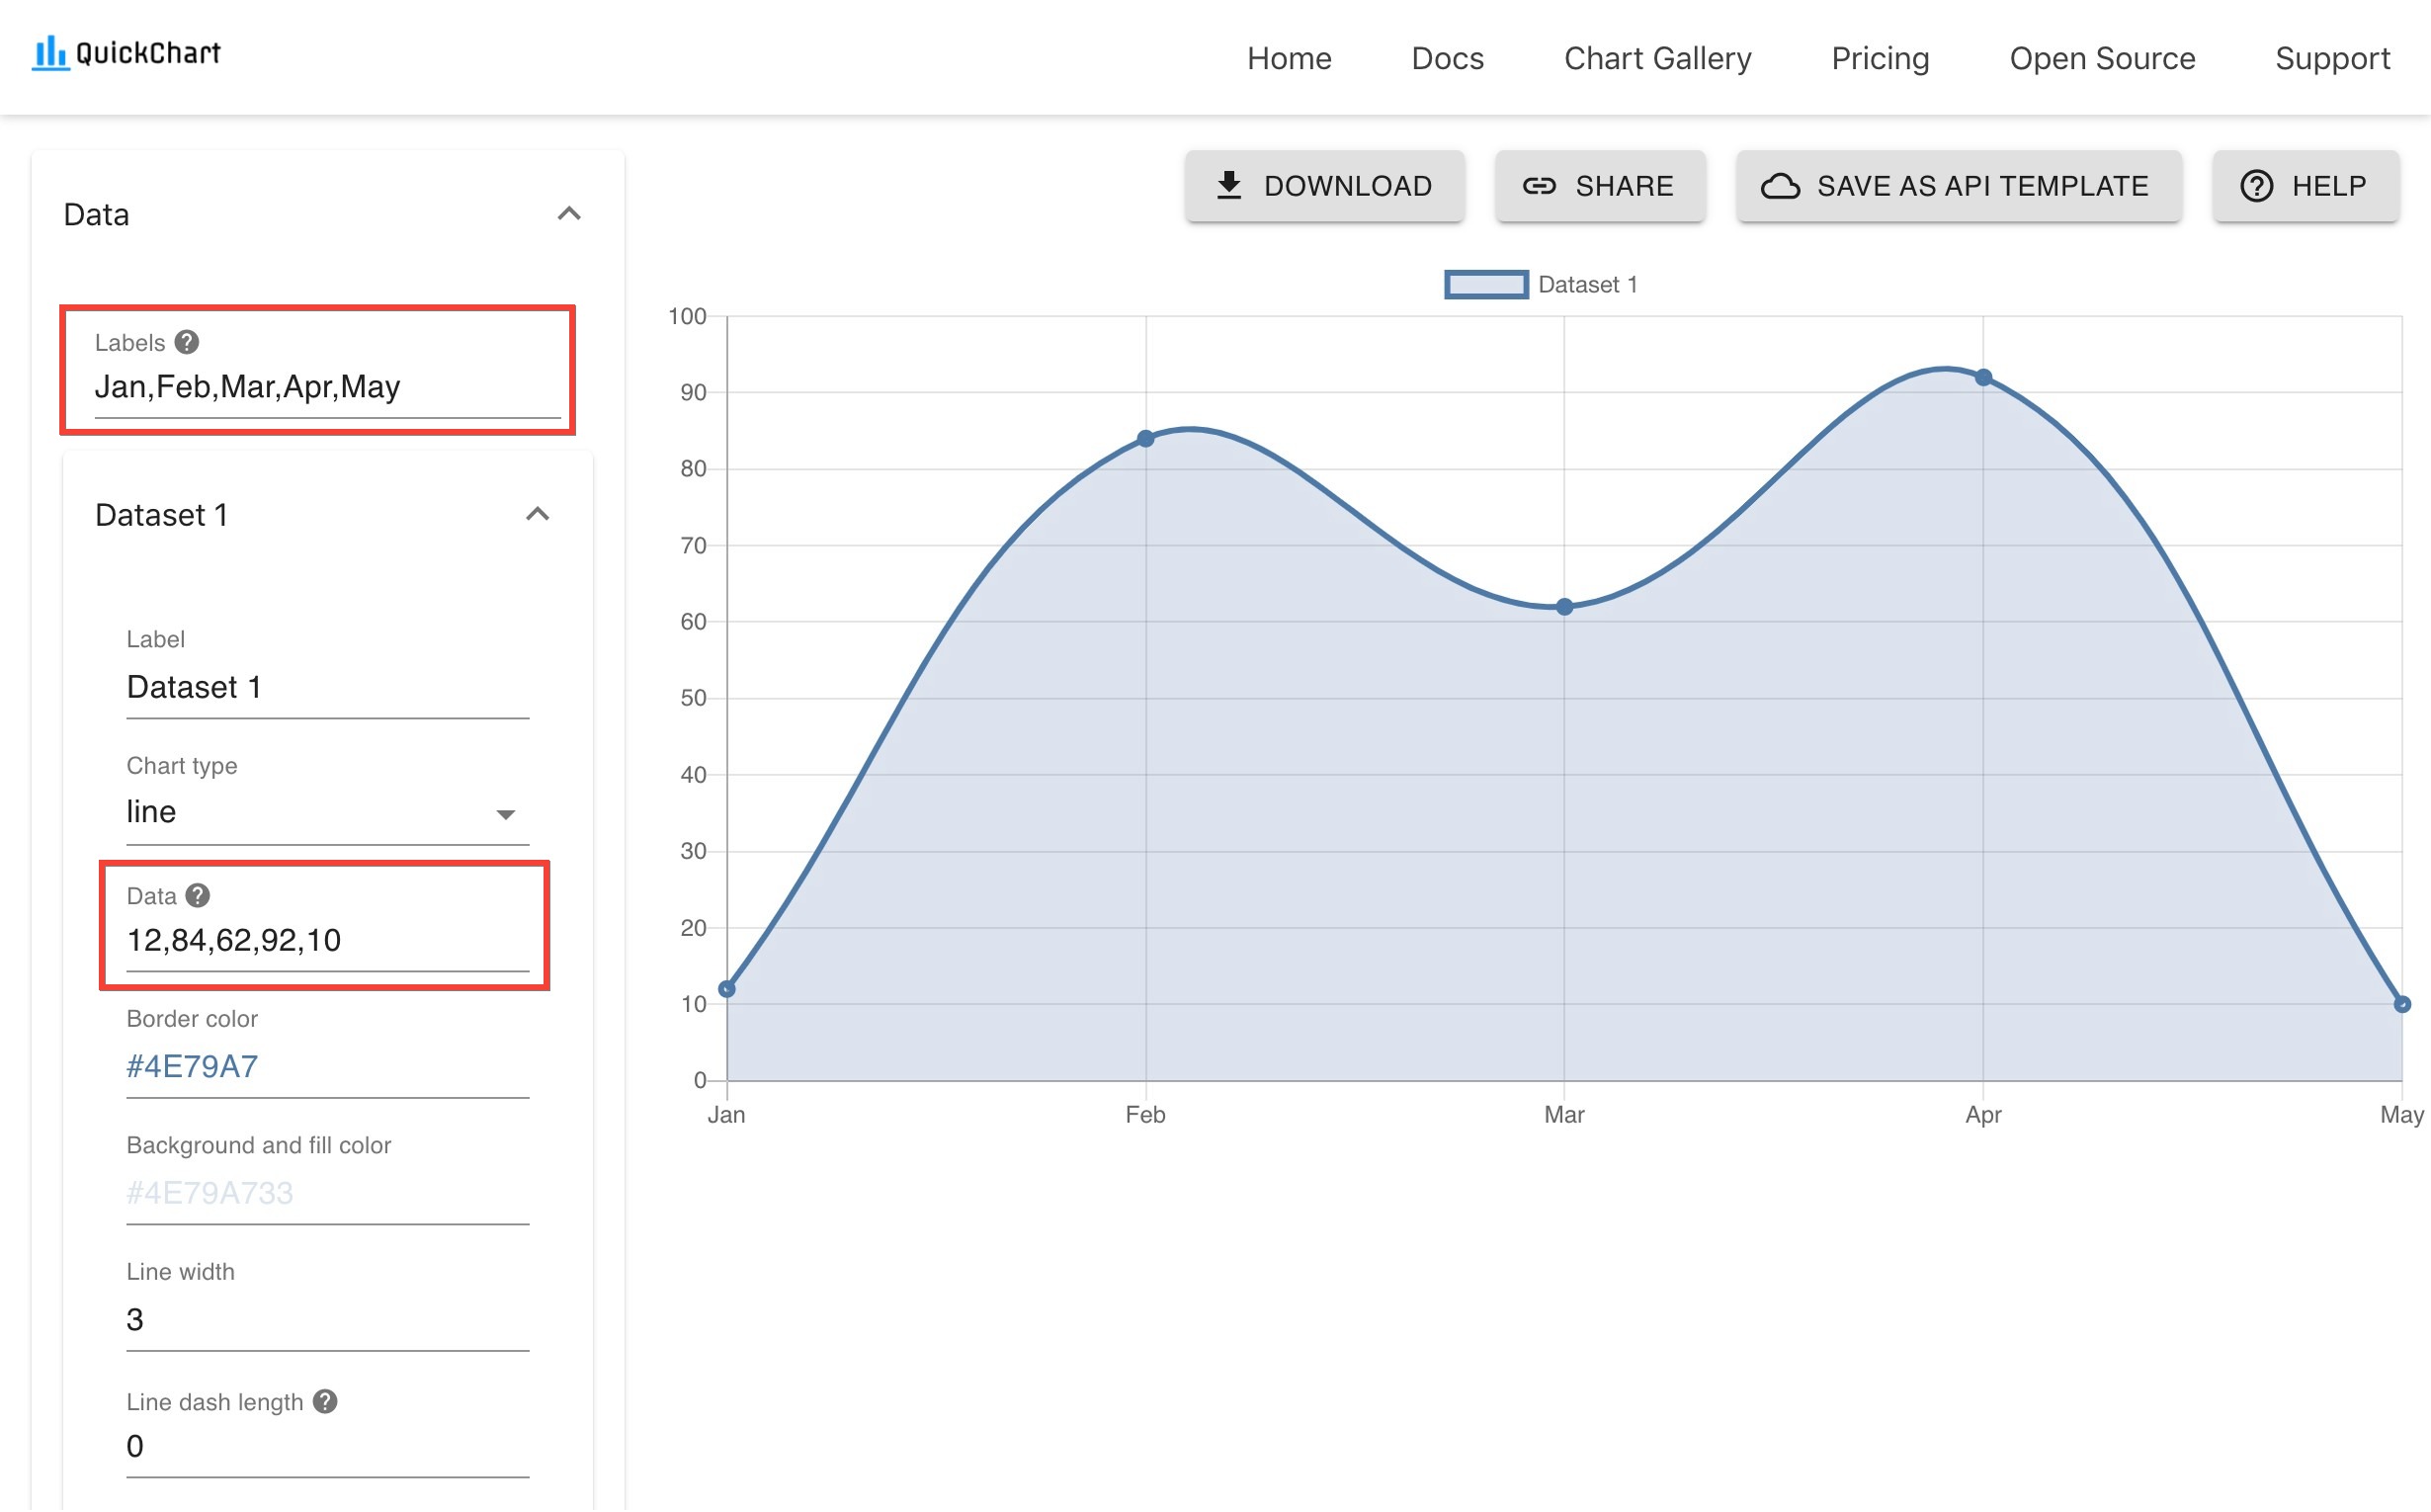
To get started, add some dummy or example data. The chart preview will update so you can get an idea of how your visualization will work.
Enter data as comma-separated values (e.g. 10,20,30,40). Each data value maps to a label (e.g. Jan, Feb, Mar, Apr). Edit "Labels" at the top of the Data settings to change this mapping.
Using coordinates
For more advanced use cases, you may provide your data as (x, y) coordinates.
An example of category-based coordinates:
(Jan, 10), (Feb, 20), (Mar, 30), (Apr, 40). These coordinates will give you more power over how your line or scatter plot is displayed.Numeric coordinates are also accepted:
(1, 50), (10, 40), (12, 20), (8, 10). This format is most commonly used for scatter plots, and requires you to change your Axes tolinearorlogarithmicunder settings. In this case, you should clear the "Labels" setting at the top of the Data settings - labels will be automatically generated.Time series use coordinates too. For example:
(2020-01-01, 50), (2020-03-15, 12), (2020-06-05, 40). To display time series, change the X-axis totimetype and clear the "Labels" setting in Data settings, as labels will be generated automatically.
Customize look & feel
Now that your data is set, time to make the chart look however you want.
Close the data menu to customize your chart's axes, ticks, legend, and its overall layout.
Looking for inspiration? Head over to the chart gallery - most examples are editable in the chart maker.
Dynamic datasources
The Chart Maker includes built-in support for pulling data from external datasources. If you choose to configure one of these datasources, the chart will update automatically when the datasource is updated.
How to configure Google Sheets
-
Create a Google Sheet and copy your data into it. Here's an example sheet.
-
Configure the sharing setting so that outsiders can have access to it. This will allow the Chart Maker to access your data. To do this, click the green "Share" button and change the setting to "Anyone with the link":
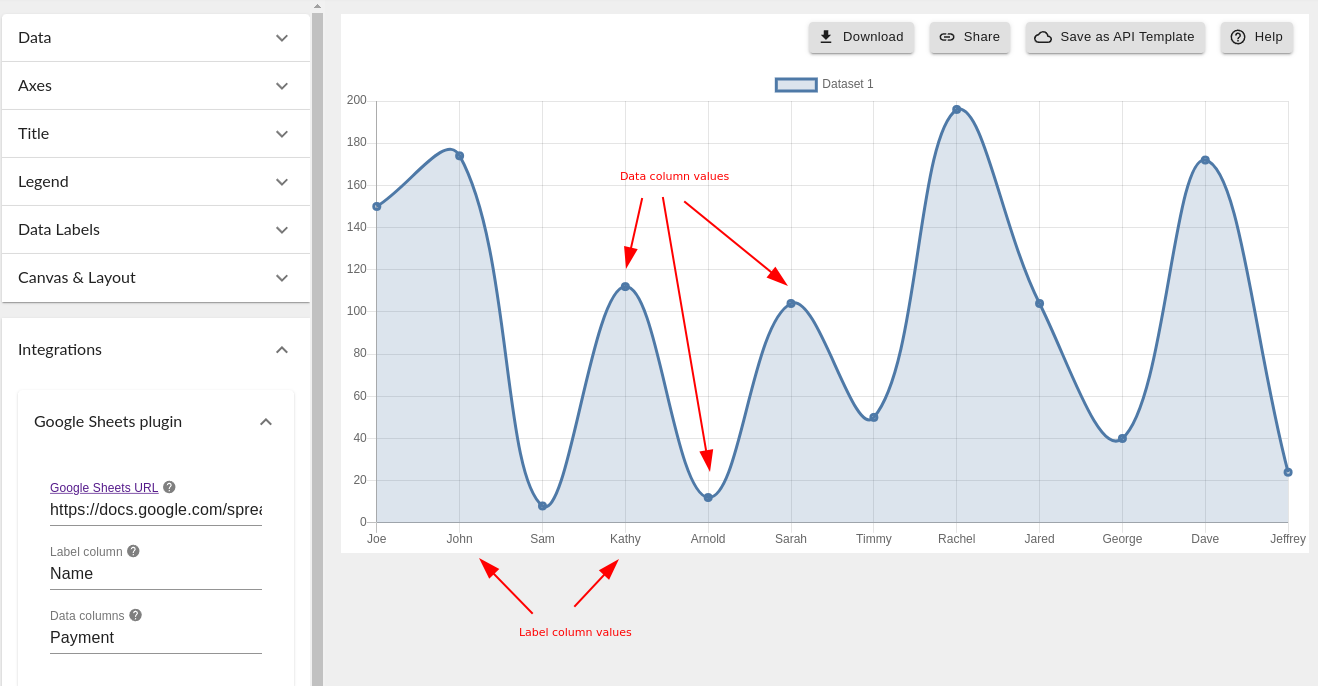
- In the Chart Maker, open Integrations > Google Sheets plugin settings. Paste your sheet URL and enter the names of the columns.
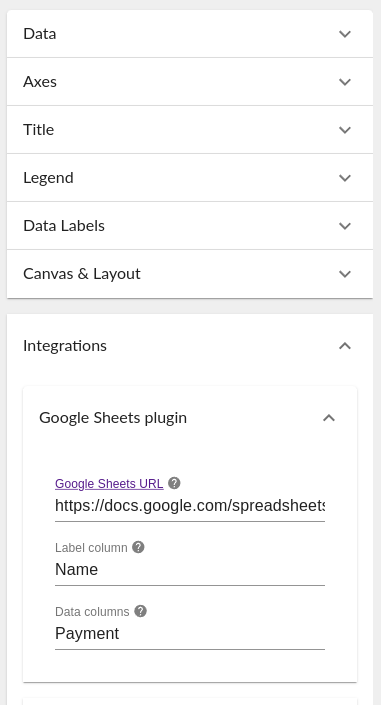
- If you've filled everything out correctly, your data will appear!
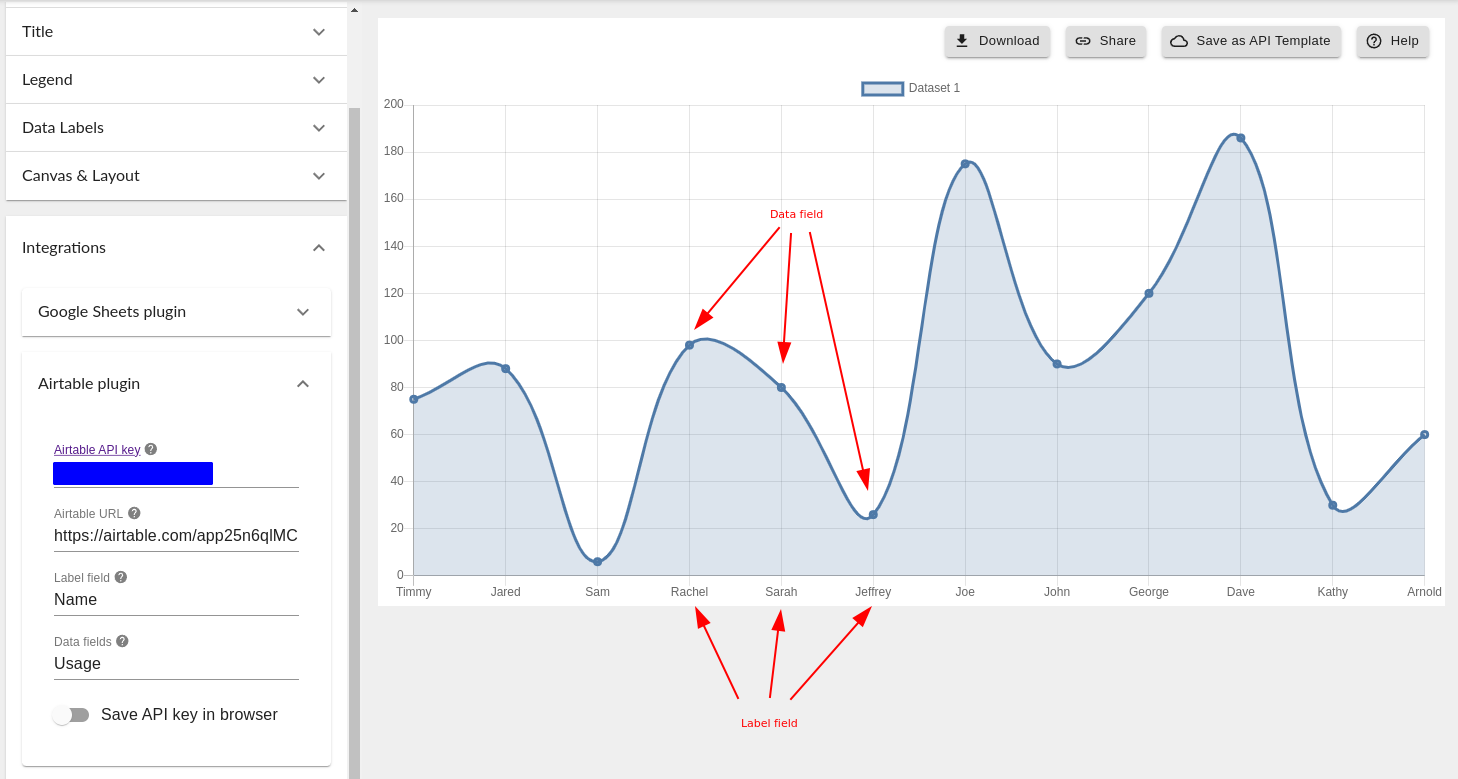
How to configure Airtable
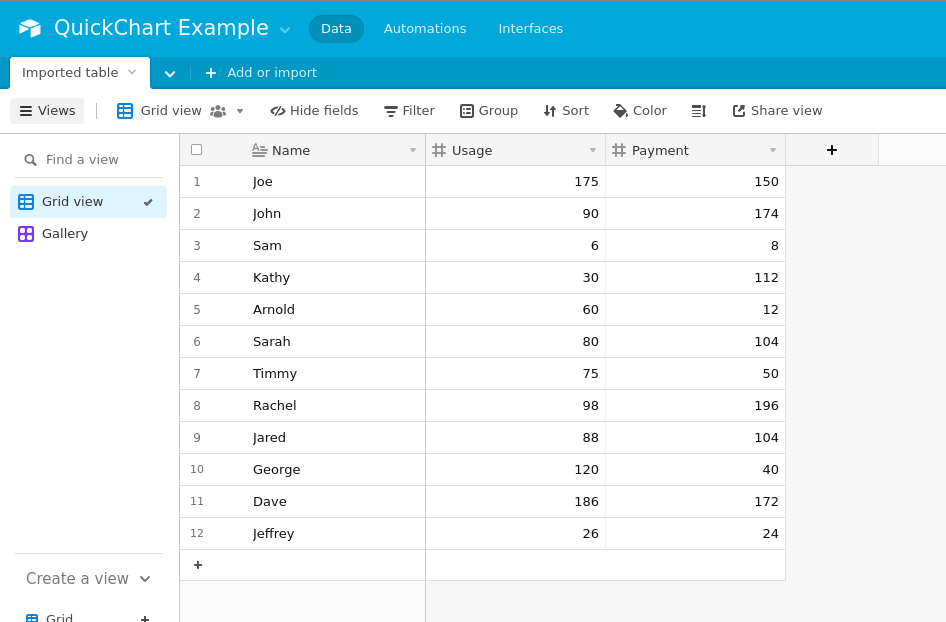
1. Create a base and put your data in it. Create a table or view with 1 column containing labels and 1+ data columns. Here's an example table.
2. Generate an API key. Go to https://airtable.com/account and grab your Airtable API key (or generate a new one).
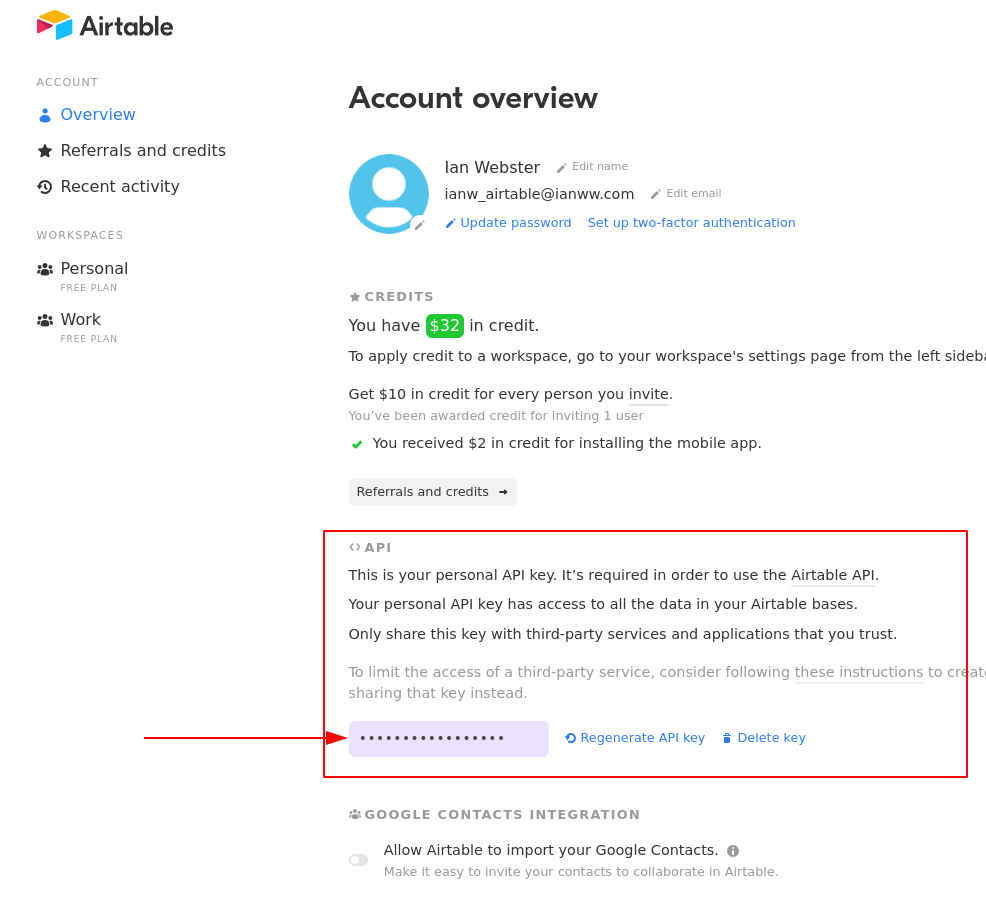
Your Airtable API key is protected and not revealed to anyone who views or edits your chart.
When you provide your Airtable API key, we generate a "masked" secret that allows access only to the specific table you provided to the Chart Maker. This lets chart viewers pull data from your table without revealing your account API key. The chart does, in theory, have access to the table, so you should make sure there is no other sensitive information in the table.
- Configure the Chart Maker. Switching back to the Chart Maker, open the Integrations > Airtable plugin settings. Paste your API key and the URL to your Airtable base.
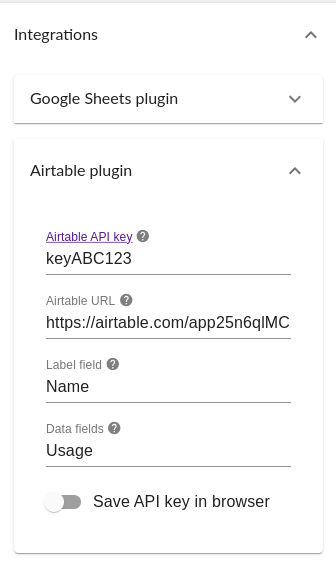
- If you've filled everything out correctly, your data will appear!
Save the template
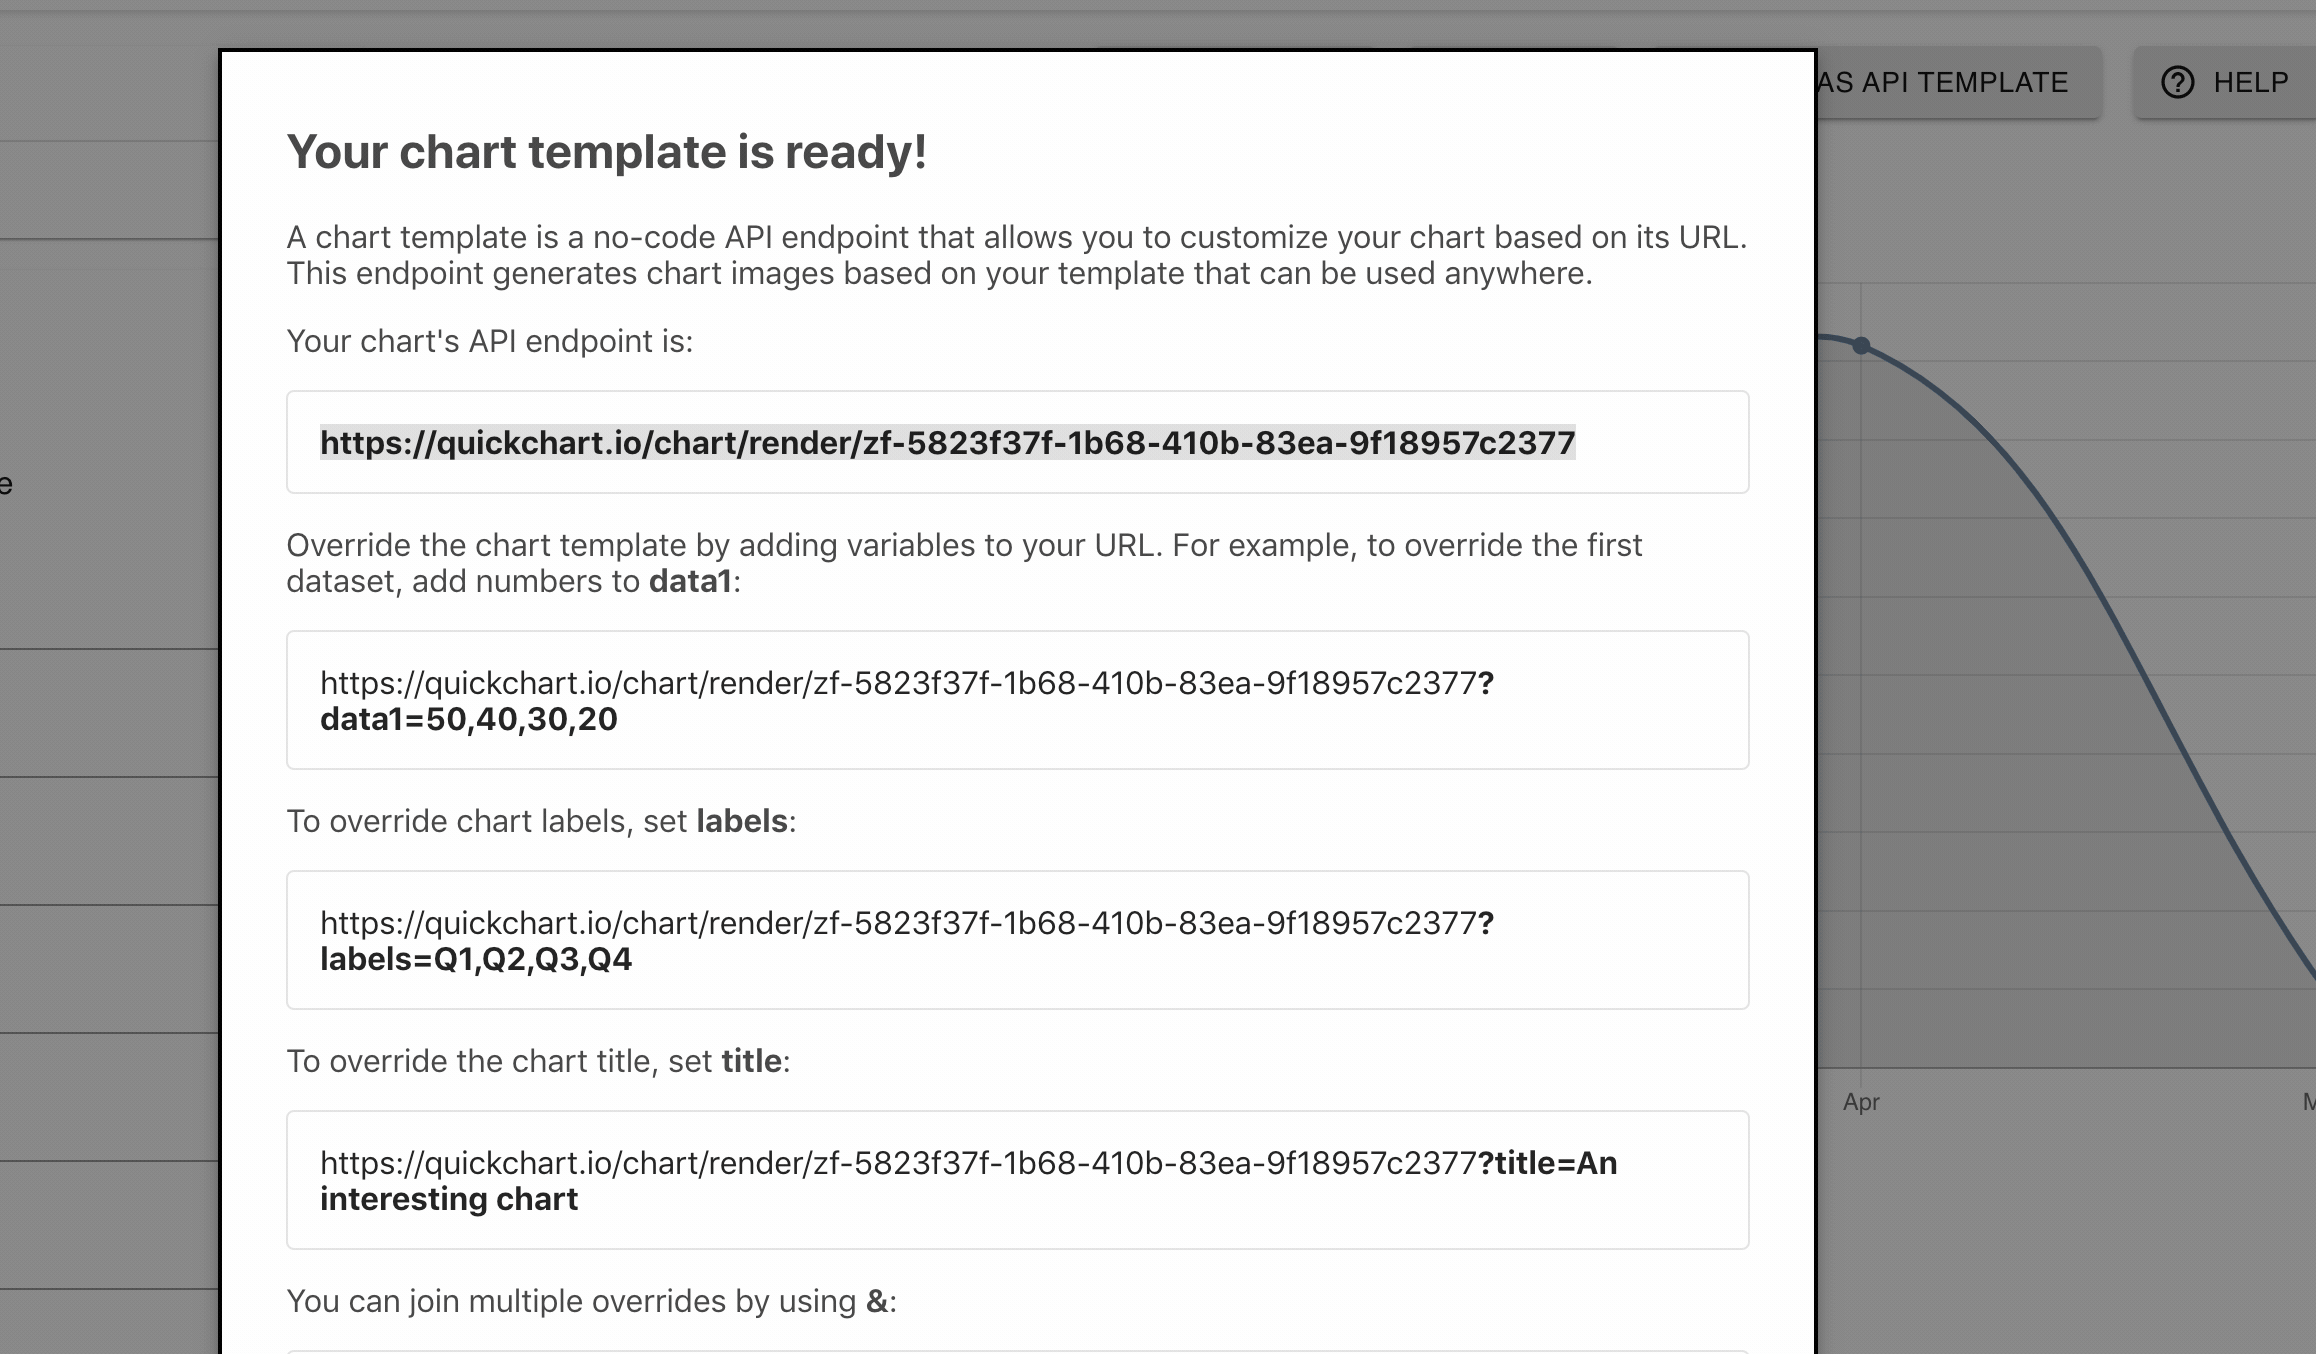
Click Save as API Template in the top right.
You'll be presented with an API endpoint. This is the base URL of your chart. If you go to it, you will see a chart image. The URL can be further customized to override properties of your chart.
Use the no-code chart API
In the following examples, we use custom values to override three chart properties:
- Chart title
- Dataset labels
- Data
These customizations are passed as URL parameters. For example, to override chart title, take the base URL and add the following:
https://quickchart.io/chart/render/zf-abc-123?title=New title
You can join URL parameters together using the & symbol. For example:
https://quickchart.io/chart/render/zf-abc-123?title=New title&labels=Q1,Q2,Q3,Q4
To override data, use data1, data2, data3, ..., for each dataset on the chart.
For example, to override the first (primary) dataset:
https://quickchart.io/chart/render/zf-abc-123?data1=40,60,80,100
To override multiple datasets and the chart title:
https://quickchart.io/chart/render/zf-abc-123?data1=40,60,80,100&data2=5,6,7,8&title=Updated chart
Real example
We have the following chart endpoint:
https://quickchart.io/chart/render/9a560ba4-ab71-4d1e-89ea-ce4741e9d232
It looks like this:
Let's override this chart's title:
https://quickchart.io/chart/render/9a560ba4-ab71-4d1e-89ea-ce4741e9d232?title=Updated chart
And now let's add some more data and labels to the chart. This will override the data but keep the same style of chart that I created in the chart maker:
https://quickchart.io/chart/render/9a560ba4-ab71-4d1e-89ea-ce4741e9d232?title=Updated chart&data1=50,60,80&labels=Jan,Feb,Mar
Customizable properties
The following chart-level properties can be overridden:
| Property Name | Description | Example |
|---|---|---|
title | Chart title | title=My chart title |
labels | Dataset labels | labels=Series 1,Series 2,Series 3 |
width | Chart width | width=500 |
height | Chart height | height=300 |
backgroundColor | Chart background | backgroundColor=rgba(122, 90, 122, 0.5) |
The following series-level properties can be overridden. Replace N with the series number that you want to override:
| Property Name | Description | Example |
|---|---|---|
dataN | Series values | data1=1,2,3,4,5&data2=6,7,8,9,10 |
backgroundColorN | Background color of series | backgroundColor1=red&backgroundColor2=blue |
borderColorN | Border color of series | borderColor1=red&borderColor2=blue |
labelN | Label of series¹ | label1=Foo&label2=bar |
¹ These labels are applicable only to certain kinds of charts, such as radar charts. In most cases you should override the labels chart parameter.
When overriding properties, you must URL-encode special characters. Your browser will do this for you automatically, but if you're using a no-code tool you may have to URL-encode property values.
For example, the special character # is URL-encoded as %23. This means hex code #fa1f5b should be passed as %23fa1f5b.
Embedding an interactive chart
To display the chart with interactive tooltips in an iframe, take the unique portion of the shortened URL and append it to the /chart-maker/view/ endpoint.
For example, given the API endpoint:
https://quickchart.io/chart/render/9a560ba4-ab71-4d1e-89ea-ce4741e9d232
Here is the corresponding iframe URL:
https://quickchart.io/chart-maker/view/9a560ba4-ab71-4d1e-89ea-ce4741e9d232
You can embed it like a regular iframe. Be sure to set a frame width and height that is compatible with your chart. Here's an HTML example:
<iframe
  src="demo_iframe.htm"
  frameborder="0"
  height="500"
  width="300"
  title="Iframe Example"
></iframe>
Advanced API features
If you are willing to dive into the JSON/Javascript configuration, get even more control over the appearance and behavior of your chart. See main API documentation for details.
Need help?
The first step is to ask in our community, which we monitor every day. Feel free to contact me or contact support if you get stuck or have questions. We'll get back to you quickly!
