How to create and send charts in email
Email is a ubiquitous format, but it comes with limitations. Mail clients like Gmail and Outlook remove Javascript, SVG, and other alternatives. This means in order to include a chart or graph in email, you must render it as an image.
This tutorial explains how to use the open-source QuickChart project to display a simple bar chart in the body of an email.
Normally, rendering dynamic charts at scale is resource-intensive, requiring a server render farm, headless browsers, and other configuration.
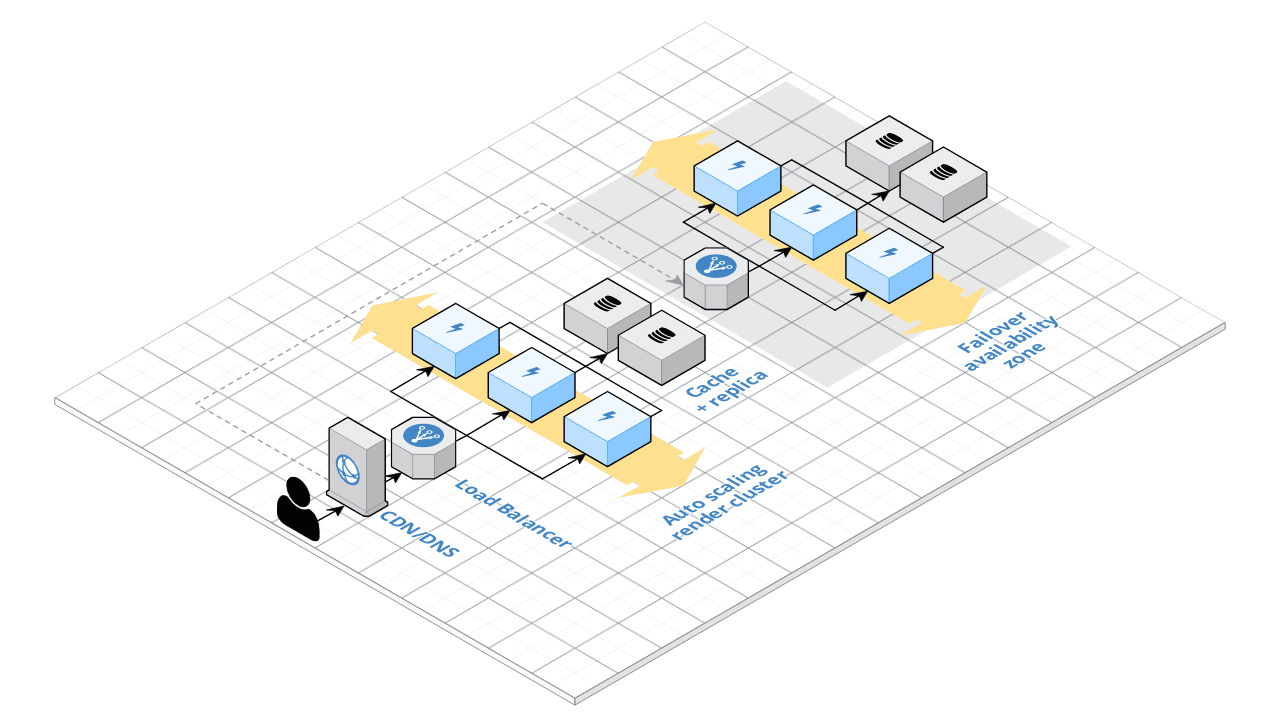
We will remove this complexity by using a service that renders graphs for us. A specially constructed URL sent to the QuickChart API will return a chart image. Because it's just a matter of building a URL, it's easy to do in your existing programming environment.
By changing the URL, you can make the chart dynamic. The API is built on Chart.js, the most popular frontend charts library, which means it's very easy to customize your chart.
Render the chart image
The main QuickChart endpoint is https://quickchart.io/chart. Use this as the base URL, then add some query parameters:
chart: The Chart.js object (required). Check out the Chart.js docs for many different chart types and customization options and use the sandbox editor to test out your configs.width: Width of chart in pixels (optional)height: Height of chart in pixels (optional)devicePixelRatio: Ratio between physical pixels and logical pixels. Defaults to 2.0 for retina support (optional)- View more parameters in the documentation
Let's suppose you built your Chart.js config and it looks like this:
{
  type: 'bar',
  data: {
    labels: [2012, 2013, 2014, 2015, 2016],
    datasets: [{
      label: 'Users',
      data: [120, 60, 50, 180, 120]
    }]
  }
}
As you can see, we're building a graph of users from 2012 through 2016. You can preview this graph by pasting the config into the testing sandbox.
Take the Chart.js config and put it into the main endpoint URL:
https://quickchart.io/chart?c={type:'bar',data:{labels:[2012,2013,2014,2015,2016],datasets:[{label:'Users',data:[120,60,50,180,120]}]}}This URL will render the chart when your browser loads it. To include it in an email, all we need to do is put the URL in an image tag:
<img src="https://quickchart.io/chart?c={type:'bar',data:{labels:[2012,2013,2014,2015,2016],datasets:[{label:'Users',data:[120,60,50,180,120]}]}} />This displays the chart image, like so:
You can safely embed this chart directly in your email. It doesn't require any Javascript, and any email client like Gmail or Outlook will display your chart.
Email a chart in any programming language
Because a chart is just defined by its URL, you may construct a QuickChart URL in any programming language. Follow the instructions above to build your chart configuration, then put it in an <img> tag in your email.
This lightweight approach avoids third-party dependencies. That said, QuickChart has published libraries for a few languages. See the most up-to-date list here. We've also included many examples below.
Once you've generated the chart, you can use any existing email service (such as Mailgun or Sendgrid) to send an email.
For more advanced chart use cases, you may use your language's HTTP library in order to generate short URLs for your chart.
Email charts with Python
Here's how to use Python to generate and email charts. First, build your Chart.js config. In this example, we'll display a simple bar graph:
chart_config = {
'type': 'bar',
'data': {
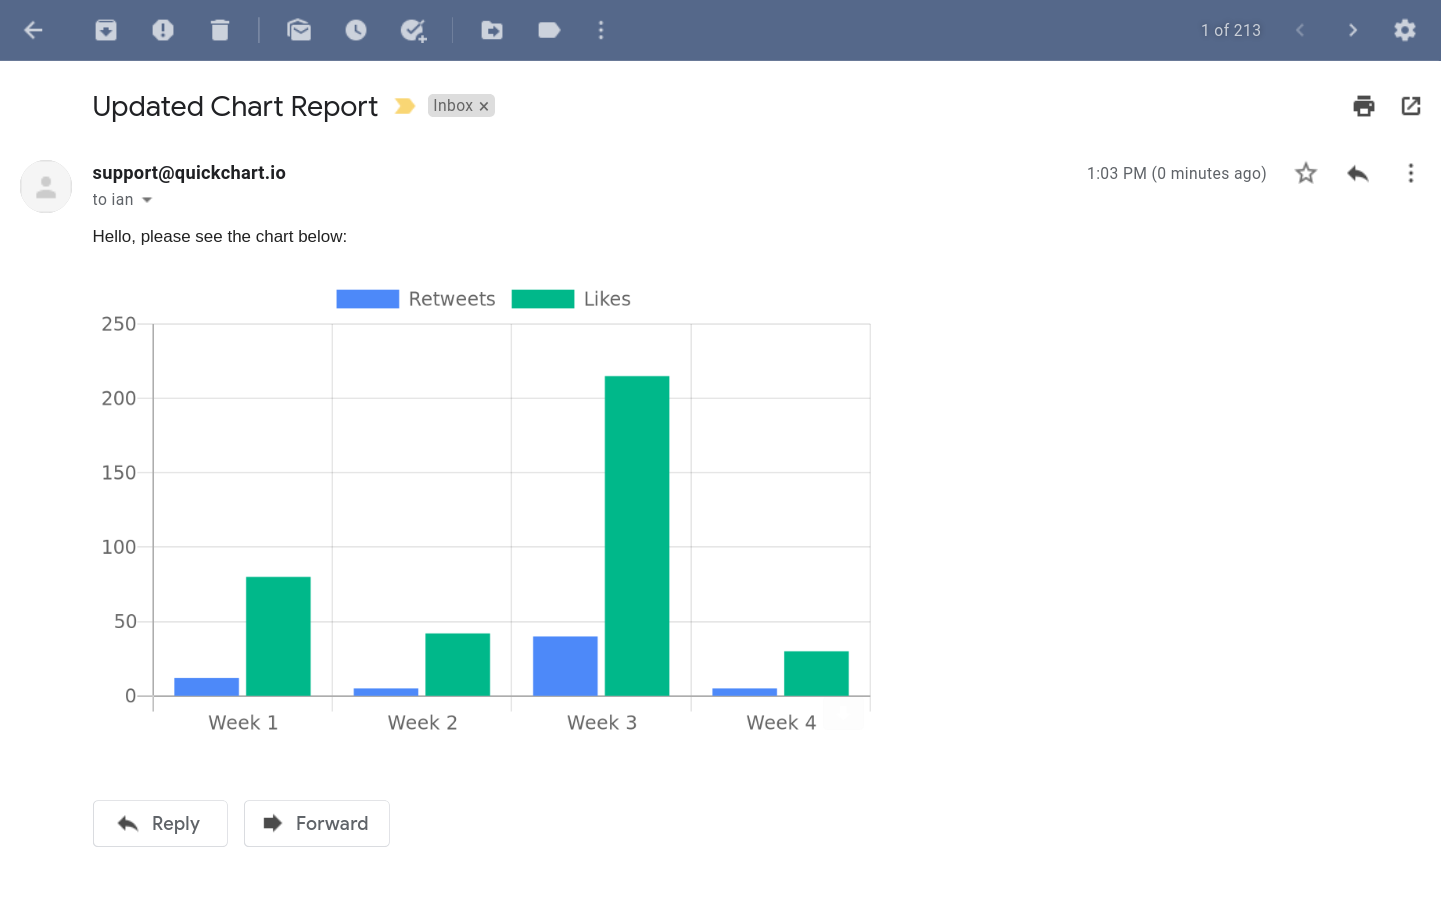
'labels': ['Week 1', 'Week 2', 'Week 3', 'Week 4'],
'datasets': [{
'label': 'Retweets',
'data': [12, 5, 40, 5]
}, {
'label': 'Likes',
'data': [80, 42, 215, 30]
}]
}
}))
Now, let's build our email message as a string. In order to build the image chart URL, we'll convert the chart config to JSON and URL encode it.
import json
from urllib.parse import quote

encoded_config = quote(json.dumps(chart_config))
chart_url = f'https://quickchart.io/chart?c={encoded_config}'

email_message = f"""Hello, this is my email body containing a chart image. Please see the chart below:
<br><br>
<img src="{chart_url}" />
"""
Note that you can also use the quickchart-python library to build your chart and generate its image URL.
Now that we have created the email body, the next step is to decide how we want to send the email. You can do this using any method that's already available to you in Python, whether it's using your own SMTP server, Gmail, or an email-sending service like Mailgun or Sendgrid.
To finish it off, let's just use the Mailgun API:
import requests

request_url = f'https://api.mailgun.net/v2/{DOMAIN}/messages'
request = requests.post(request_url, auth=('api', 'your_api_key_here'), data={
    'from': '[email protected]',
    'to': '[email protected]',
    'subject': 'Updated Chart Report with Mailgun',
    'html': email_message,
})

print(f'Status: {request.status_code}')
print(f'Body:   {request.text}')
Or using Sendgrid's Python library:
from sendgrid import SendGridAPIClient
from sendgrid.helpers.mail import Mail

message = Mail(
    from_email='[email protected]',
    to_emails='[email protected]',
    subject='Updated Chart Report with Sendgrid',
    html_content=email_message)
try:
    sg = SendGridAPIClient('your_api_key_here')
    response = sg.send(message)
    print(response.status_code)
    print(response.body)
    print(response.headers)
except Exception as e:
    print(e.message)
Email charts with Javascript/Node.js
Sending charts using Javascript or node.js is straightforward. You can either build the URL as described above, or npm install quickchart-js.
Use the library like so. First, generate the URL for your chart image and build your email message:
const QuickChart = require('quickchart-js');

const myChart = new QuickChart();
myChart
  .setConfig({
    type: 'bar',
    data: { labels: ['Hello world', 'Foo bar'], datasets: [{ label: 'Foo', data: [1, 2] }] },
  })
  .setWidth(800)
  .setHeight(400)
  .setBackgroundColor('transparent');

const chartImageUrl = myChart.getUrl();

const message = `Hello, please see the chart below:
<br><br>
<img src="${chartImageUrl}" />
`;
Then, send the email with Mailgun or some other preferred email library:
const mailgunGenerator = require('mailgun-js');
const mailgun = mailgunGenerator({
  apiKey: 'abc123',
  domain: 'xyz.com',
});

const data = {
  from: '[email protected]',
  to: '[email protected]',
  subject: 'Updated Chart Report',
  html: message,
};

mailgun.messages().send(data, (err, body) => {
  console.log(body);
});
Here's the Sendgrid equivalent:
const sgMail = require('@sendgrid/mail');
sgMail.setApiKey('your_api_key_here');
const msg = {
  to: '[email protected]',
  from: '[email protected]',
  subject: 'Updated Chart Report',
  html: message,
};
sgMail.send(msg);
Email charts with Java
In order to email a chart with Java, first create a string containing our Chart.js config.
You can build this JSON string dynamically if you'd like - use normal string manipulation and concatenation to substitute your data. Here's a simple example of a Chart.js config with some hardcoded values:
String chartConfig = "{" +
  "\"type\": \"bar\"," +
  "\"data\": {" +
    "\"labels\": [2012, 2013, 2014, 2015, 2016]," +
    "\"datasets\": [{" +
      "\"label\": \"Users\"," +
      "\"data\": [120, 60, 50, 180, 120]" +
    "}]" +
  "}" +
"}";
Suppose we wanted to replace the data with dynamic values from an array. Here's one approach:
String chartConfigTemplate = "{" +
  "\"type\": \"bar\"," +
  "\"data\": {" +
    "\"labels\": [2012, 2013, 2014, 2015, 2016]," +
    "\"datasets\": [{" +
      "\"label\": \"Users\"," +
      "\"data\": [ %DATA_VALUES% ]" +
    "}]" +
  "}" +
"}";

ArrayList<Integer> values = new ArrayList<Integer>();
values.add(120);
values.add(60);
values.add(50);
values.add(180);
values.add(120);

String chartConfig =
    chartConfigTemplate.replace("%DATA_VALUES%", values.toString());
You can also build the JSON completely dynamically using org.json or a similar library.
Now that we have our chart config, pack this into the QuickChart API URL. We use java.net.URLEncoder:
String chartUrl =
    "https://quickchart.io/chart?width=500&height=200&chart=" +
    URLEncoder.encode(chartConfig, StandardCharsets.UTF_8);

String message =
    "Hello, please see the chart below:<br><br><img src=\"" + chartUrl + "\">";
That's it for generating the chart. Now all we need to do is send the chart image in the body of the email:
import com.mashape.unirest.http.HttpResponse;
import com.mashape.unirest.http.JsonNode;
import com.mashape.unirest.http.Unirest;
import com.mashape.unirest.http.exceptions.UnirestException;

public class MGSample {
    public static JsonNode sendSimpleMessage() throws UnirestException {

        // ... Generate the chart image

        // Send the email
        HttpResponse<JsonNode> request = Unirest.post("https://api.mailgun.net/v3/" + YOUR_DOMAIN_NAME + "/messages")
            .basicAuth("api", API_KEY)
            .field("from", "Bob Smith <[email protected]>")
            .field("to", "[email protected]")
            .field("subject", "Chart Report")
            .field("html", message)
            .asJson();
        return request.getBody();
    }
}
See here for the equivalent Java Sendgrid example.
Email charts with C#
To email a chart in C#, first we create our Chart.js config. Basic chart configs are JSON, so you can use any method of creating JSON objects in C# that you prefer. In this case, we'll just put the config directly in our source code:
String chartConfig = @"{
  ""type"": ""bar"",
  ""data"": {
    ""labels"": [2012, 2013, 2014, 2015, 2016],
    ""datasets"": [{
      ""label"": ""Users"",
      ""data"": [120, 60, 50, 180, 120]
    }]
  }
}";
Next, put this chart config object in the QuickChart API URL and build our message:
String chartUrl = "https://quickchart.io/chart?width=500&height=200&chart=" + Uri.EscapeDataString(chartConfig);

String message = $"Hello, please see the chart below:<br><br><img src=\"{chartUrl}\">"
Now that we've constructed our email body, all we need to do is send the email. This part is easy if you're using a third-party email API. Here's an example using Sendgrid C#:
var apiKey = "your_api_key_here";
var client = new SendGridClient(apiKey);
var msg = new SendGridMessage()
{
    From = new EmailAddress("[email protected]", "My Name"),
    Subject = "Chart Report Update",
    HtmlContent = message
};
msg.AddTo(new EmailAddress("[email protected]", "Recipient Name"));
var response = await client.SendEmailAsync(msg).ConfigureAwait(false);
Email charts with PHP
To get started with sending chart emails in PHP, build a simple JSON object that defines your chart. Here's a simple example:
$chartConfig = '{
  "type": "bar",
  "data": {
    "labels": [2012, 2013, 2014, 2015, 2016],
    "datasets": [{
      "label": "Users",
      "data": [120, 60, 50, 180, 120]
    }]
  }
}';
This is a static example, but let's suppose you wanted to fill your data object automatically using the contents of an array. It might look something like this:
$data = array(120, 60, 50, 180, 120);

$chartConfig = '{
  "type": "bar",
  "data": {
    "labels": [2012, 2013, 2014, 2015, 2016],
    "datasets": [{
      "label": "Users",
      "data": [' . implode(',', $data) . ']
    }]
  }
}';
You can even build the whole thing as a nested PHP array and get the string using json_encode:
$chartConfigArr = array(
  'type' => 'bar',
  'data' => array(
    'labels' => array(2012, 2013, 2014, 2015, 2016),
    'datasets' => array(
      array(
        'label' => 'Users',
        'data' => array(120, 60, 50, 180, 120),
      )
    )
  )
);
$chartConfig = json_encode($chartConfigArr);
Once you have a chart configuration that you're happy with, we are ready to render it as an image. This creates a chart with width of 500 pixels and height of 300 pixels:
$chartUrl = 'https://quickchart.io/chart?w=500&h=300&c=' . urlencode($chartConfig);
We just need to take this URL and include it as an image tag in our email. Here's an example using the PHP Sendgrid library:
$email = new \SendGrid\Mail\Mail();
$email->setFrom("[email protected]", "From User");
$email->setSubject("Chart Report Update");
$email->addTo("[email protected]", "Recipient User");
$email->addContent(
    "text/html", "Please see the chart below:<br><br><img src=\"$chartUrl\">"
);
$sendgrid = new \SendGrid('your_api_key_here');
try {
    $response = $sendgrid->send($email);
    print $response->statusCode() . "\n";
    print_r($response->headers());
    print $response->body() . "\n";
} catch (Exception $e) {
    echo 'Caught exception: ',  $e->getMessage(), "\n";
}
Email charts with Ruby
In order to generate a chart image that can be emailed in Ruby, we must construct the chart JSON.
You can do this by creating a Chart.js config string directly:
chart_config = '{
  "type": "bar",
  "data": {
    "labels": [2012, 2013, 2014, 2015, 2016],
    "datasets": [{
      "label": "Users",
      "data": [120, 60, 50, 180, 120]
    }]
  }
}'
Or you can construct it as JSON using a Ruby hash:
require 'json'

raw_config = {
  'type': 'bar',
  'data': {
    'labels': [2012, 2013, 2014, 2015, 2016],
    'datasets': [{
      'label': 'Users',
      'data': [120, 60, 50, 180, 120]
    }]
  }
}

chart_config = JSON[raw_config]
Now, we can take this config, encode it into a chart URL, and build our email message:
require 'cgi'

chart_url = 'https://quickchart.io/chart?w=500&h=300&c=' + (CGI.escape chart_config)

email_message = "Hello, please see the chart below:<br><br><img src=\"#{chart_url}\">"
Then, send the chart image in the email body using the Sendgrid Ruby gem (or any other method of sending email in Ruby):
require 'sendgrid-ruby'
include SendGrid

from = Email.new(email: '[email protected]')
to = Email.new(email: '[email protected]')
subject = 'Chart Report Update'
content = Content.new(type: 'text/html', value: email_message)
mail = Mail.new(from, subject, to, content)

sg = SendGrid::API.new(api_key: 'your_sendgrid_api_key_here')
response = sg.client.mail._('send').post(request_body: mail.to_json)
puts response.status_code
puts response.body
puts response.headers
Advanced features
The process of building a chart image via URL is quite straightforward, but there are many ways to customize your chart. For starters, you can use the Chart.js configuration to make many other types of charts: line graphs, pie charts, mixed charts, and more.
If you're creating more complex charts, consider generating a short URL for your chart so you don't have to pack everything into the image tag.
You can also use a variety of Chart.js plugins to add more customizations annotating your chart images.
For more advanced usage and many other chart types and customization, view the documentation.
Need help?
If you have questions or need help with your chart rendering, please reach out in our community or via email.
